The Polls Knew Exactly How Many Split Ticket Voters There Were
In the wake of the 2026 midterms, pollsters have largely avoided the recriminations and criticism that they got in 2016, 2020, and 2024.
In the wake of the 2026 midterms, pollsters have largely avoided the recriminations and criticism that they got in 2016, 2020, and 2024. Predicting some kind of blue wave in advance, pundits have largely credited polls with predicting the nearly D +13 wave that washed over the entire country and swept away both houses of Congress from Republican control. This is perhaps unfair. The public polls had one of their biggest misses of all time, arguably bigger than 2016 and 2020, and not even sniffing upsets like Mississippi, and vastly underestimating Democratic margins in critical races like Texas.
The pollsters have largely avoided the usual criticisms for two reasons. First, they picked the right winner. While pollsters underestimated the size of the Democratic wave, they still showed a wave. And second, a polling error underestimating Democrats largely spares pollsters from scores of prominent Democrats demanding to know how the polls and media could so badly miss “real voters.”
But remarkably absent from the conversation has been any examination of whether the polls were useful to see the difference between candidates in the same state, even if they missed on the overall margins. The answer appears to be yes. The polls got the spread between various senate and gubernatorial races correct within essentially 5% in every single race. What’s more, the polls got the direction of the split ticket voters correct in every single race.
The chart below shows the predicted and actual spreads from each race, measured as the gap between the polling average in the gubernatorial race and the polling average in the senate race. The chart does not include races that lacked appreciable public polling.
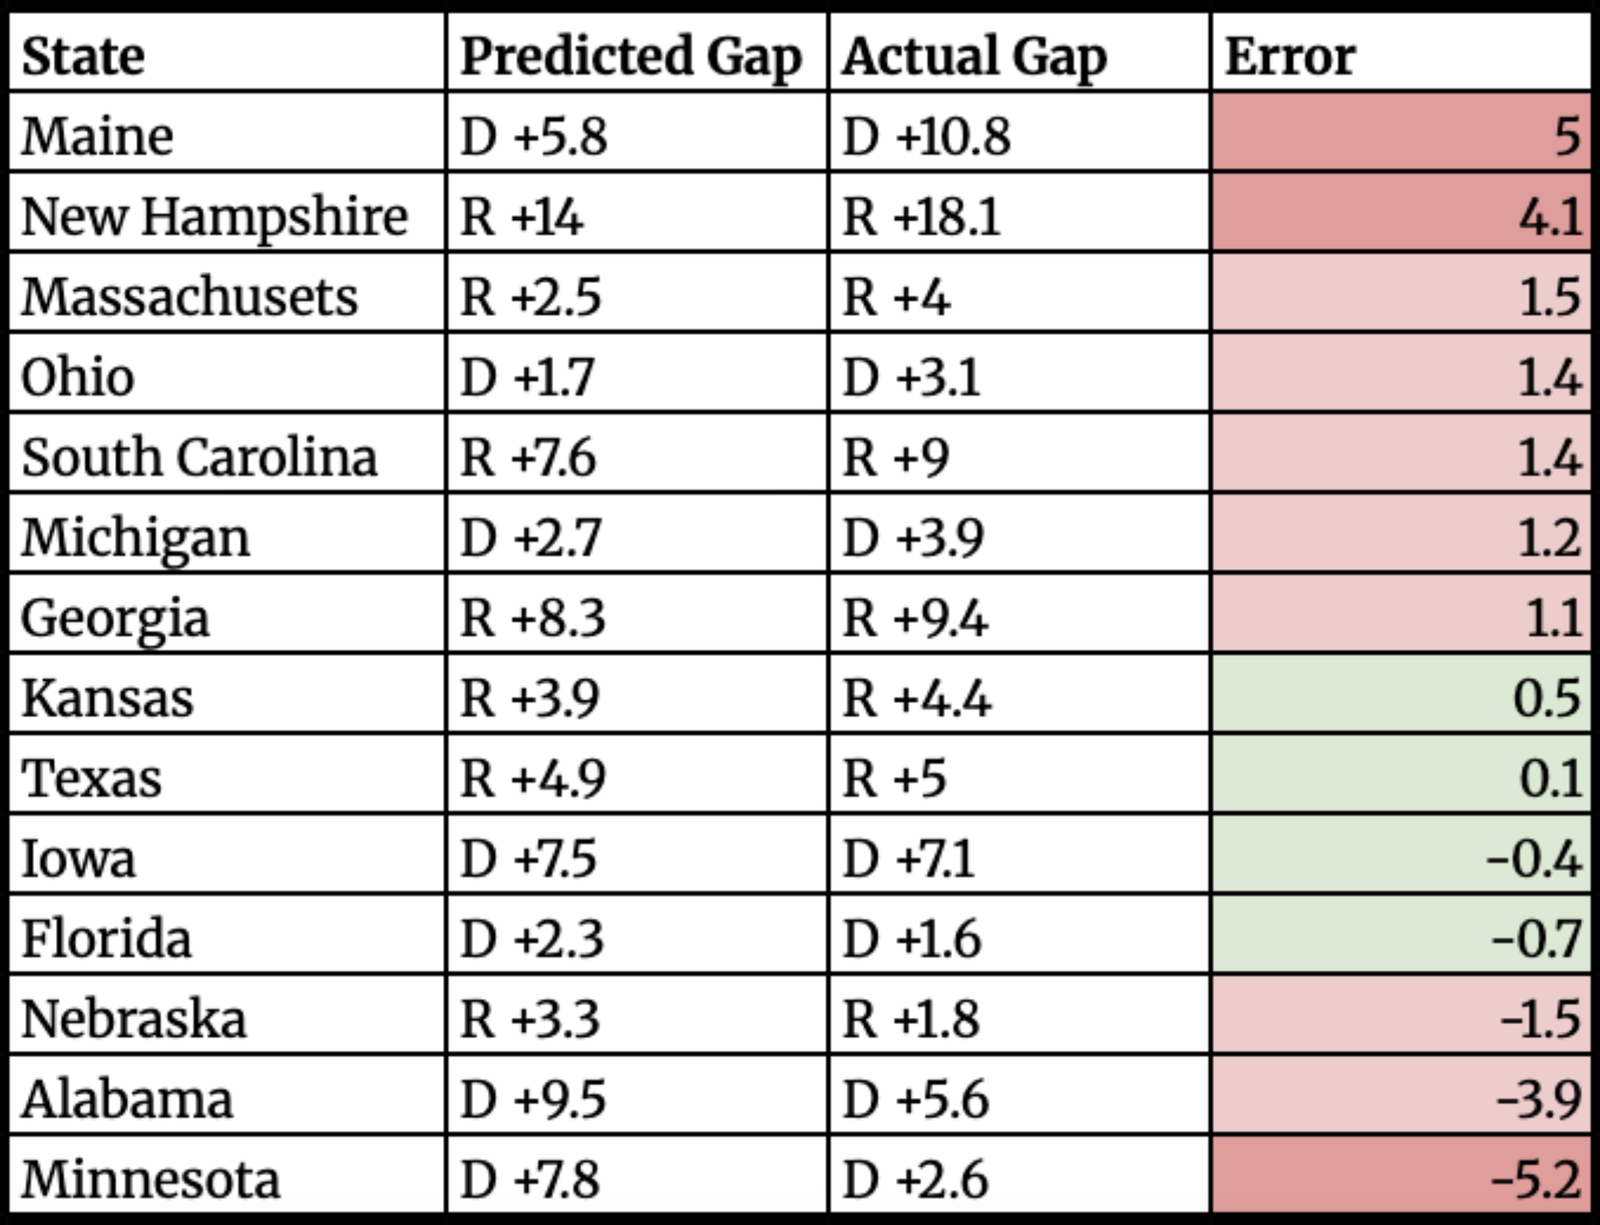
The average error across all states was just +0.32%, in terms of whether the poll over- or under-estimated the amount of split ticket voters. Measured in absolute terms, the average error was still only 2%. Polls accurately measured split ticket voters even in states that had large eventual polling errors (such as Texas and Georgia).
This is notable because it suggests that even when poll respondents differed from the eventual electorate, candidates’ relative appeal did not seem to change or depend on the type of voter. In other words, about one out of every twenty poll respondents was willing to vote for both Jon Ossoff and Rick Jackson, and that held true in the eventual electorate, even when pollsters missed what exactly that electorate would look like.
That suggests that even in the face of potential polling error, polls likely do a good job of indicating the relative strength of each candidate.
First published Nov. 10, 2026 in the FullyReporting newsletter.